The new OECD Data Explorer
The Organisation for Economic Co-operation and Development works with governments and policy makers on establishing evidence-based international standards on solutions for social, economic and environmental challenges.
The OECD is in the process of migrating its data to a new platform — the OECD Data . Users can search for datasets or browse data from topics, including:
- Agriculture
- Economy
- Environment
- Finance
- Government
- Health
- Innovation and technology
- Jobs
- Society
Each topic has a range of datasets available.
The data is relevant and it’s recent. Most datasets in the new Data were updated during 2023 and many of the datasets track back to 1950 — providing both historical and current data. The data in the OECD Data helps the OECD make informed, data-driven decisions and it gives the general public access to a wealth of data.
Data filtering
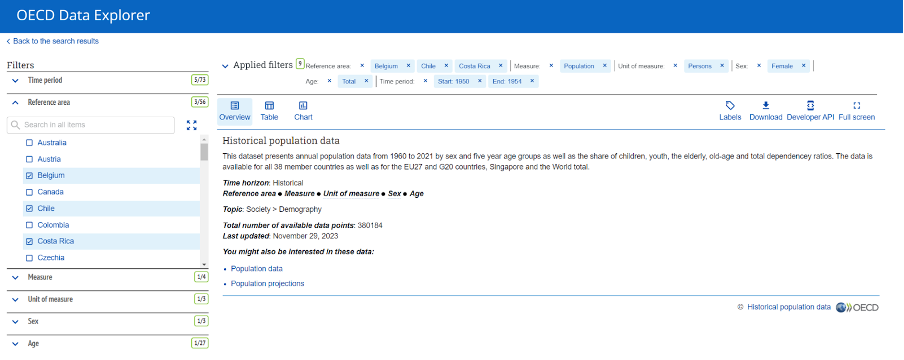
The OECD Data has incorporated a very useful filtering tool that lets the user filter the data before downloading it.
For example, when looking at the historical population data, the following filters are available
- Time period: Select individual years or a range (dating back to 1950)
- Reference area: A selection of 56 countries available
- Measure: Population and ratio measures available
- Unit of measure: Count and percentage options
- Sex: Select male, female or total
- Age: Select particular age range brackets
By applying the filters before downloading data, you can refine the data required quickly and easily.
Screenshot of the historical population data from the OECD Data Explorer

Population
The data available in the historical population looks at population for 52 countries from 1950 through to (current) 2022. With a 72-year gap, there are significant data movements over this time.
Australia's population has increased 217% over the 72 years, rising from just over 8 million in 1950 to over 25 million in 2022. However as the table below shows, there’s a decline in the birth rate and an increase in the older population.
| Australia population growth | |||
|---|---|---|---|
| Age brackets | 1950 | 2022 | Increase |
| Under 20 | 2,727,600 | 6,292,314 | 130.69% |
| 20-40 | 2,552,200 | 7,247,958 | 183.99% |
| 40-60 | 1,878,700 | 6,510,620 | 246.55% |
| 60-80 | 923,400 | 4,812,746 | 421.20% |
| Over 80 | 96,800 | 1,115,297 | 1052.17% |
| Total population | 8,178,700 | 25,978,935 | 217.64% |
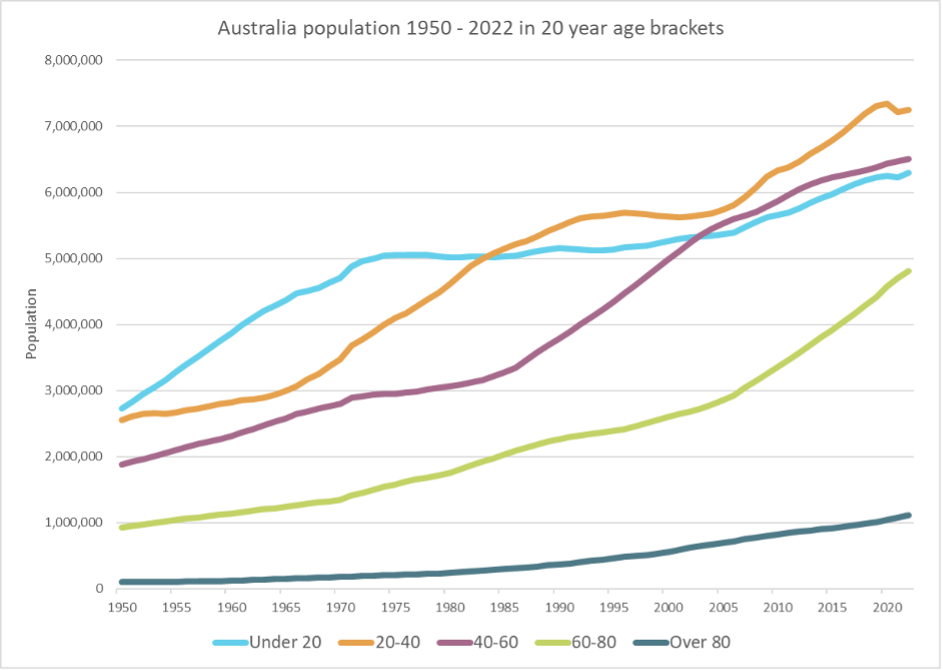
These changes in our population are highlighted on the graph below, that shows the change in Australia's population over the 72 years by 20-year age bracket.
The over 60s and over 80s have the smallest population, however there’s a steady increase in population especially in the over 60s. Many factors may contribute to these numbers, including increased health care as well as an increased birth rate following WWII.
The decline in the younger generation is also significant. Through the 1950s there was growth of on average 3.6% year-on-year in the under-20 age bracket, however this has been declining and over the past 12 years (from 2010 to 2022), the growth rate is an average of just 0.87%.
Line graph showing Australia’s population in 20-year age brackets

Broadband access
The broadband and telecom look at a range of telecommunications services for 38 countries. Salsa has looked at the data comparing 2010 to 2020 for both fixed line broadband and mobile services. The total fixed line broadband has increased 46% for these 38 countries and mobile subscriptions have increased 193% over the 10-year period.
The Czech Republic had the greatest increase of mobile subscriptions from 2010 to 2020. In 2010, there were just 542,400 mobile subscriptions and in 2020, 10,108,773 subscriptions — a staggering 1764% increase. In 2020, the Czech Republic population was 10,700,155, which means 94% of the population had a mobile subscription.
The majority of countries with a significant increase in fixed line broadband were also highly ranked in mobile subscriptions increases. As expected, there were no countries with a decline in broadband and mobile subscriptions over this 10-year period.
Protected areas
The protected areas provides country-level protected area coverage for terrestrial, marine and coastal domains calculated from the World Database on Protected Areas (WDPA).
Protected areas data is available in a range of categories, including:
- Strict nature reserves
- Wilderness areas
- National park
- Natural monument or feature
- Habitat or species management area
- Protected landscape or seascape
- Protected area with sustainable use of natural resources
While the terrestrial data is available in both square kilometres and a percentage area, the marine data is only available in square kilometres.
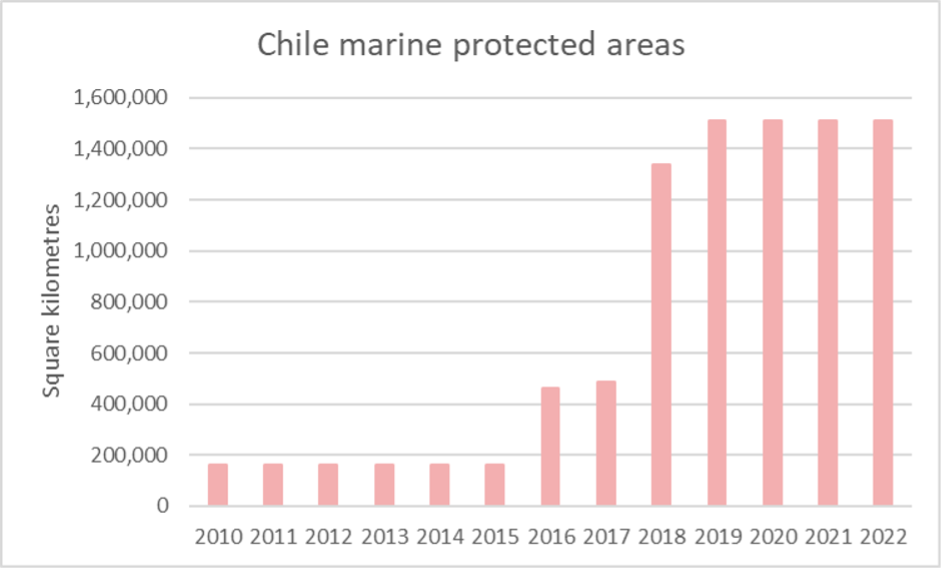
According to the data available for the countries provided, Australia had the highest marine protected area in 2022, with a total 3,036,162 km² (approximately the size of India). Chile had approximately half the total marine protected areas as Australia in 2022, with 1,510,299 km². The graph below shows that Chile has significantly increased its marine protected areas over the past 10 years.
More about the OECD
The was established in 1960 primarily with European country members, but has since grown to (current) 38 member .
The OECD has spent over 60 years advising governments on policies to support resilient, inclusive and sustainable growth. Its member countries have focused on committing to democracy and the market economy, providing a platform to compare policy experiences, seeking answers to common problems, identifying good practices, and coordinating domestic and international policies.
Stay tuned for more Open Data Insights from the World Database on Protected (WDPA) in the future.


