
QLD Emergency Department data
The Queensland Open Data has over 175,000 datasets and 14,800 resources. One of these datasets is quarterly data on Queensland emergency . The emergency department data tracks back to 2016 and provides statistics on:
- Number of attendances
- Patients seen within clinically recommended times (%)
- Median waiting time to treatment (minutes)
- Patients who did not wait for treatment (%)
- Patients admitted from the Emergency Department (%)
- Admissions to hospital within four hours (%)
- Patients whose emergency department stay was within four hours (%)
- Number of patients who left after treatment commenced
- Number of patients who did not wait for treatment
Salsa explores a selection of this data and has a closer look at where the high performance hospitals are located in the Queensland state.
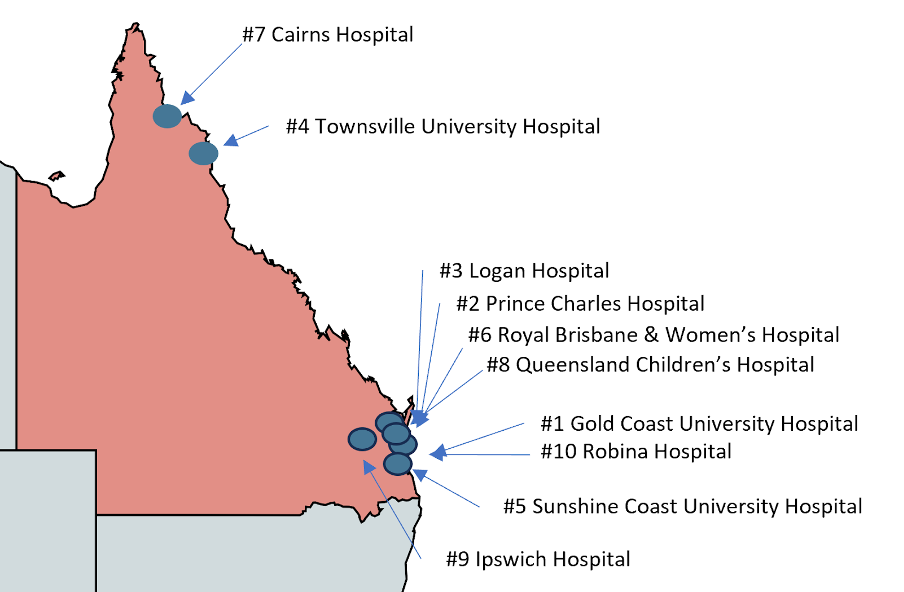
Busiest hospitals 2022
Four of the top 10 hospitals with the most attendances in 2022 were located in Brisbane, two on the Gold Coast and two in the top end of the state. Queensland saw a total hospital attendance in 2022 of 2,272,607 patients. Ten of these busy hospitals managed the care of 948,448 of these patients. Essentially, only 10% of the Queensland emergency departments cared for 42% of the state’s total attendances.
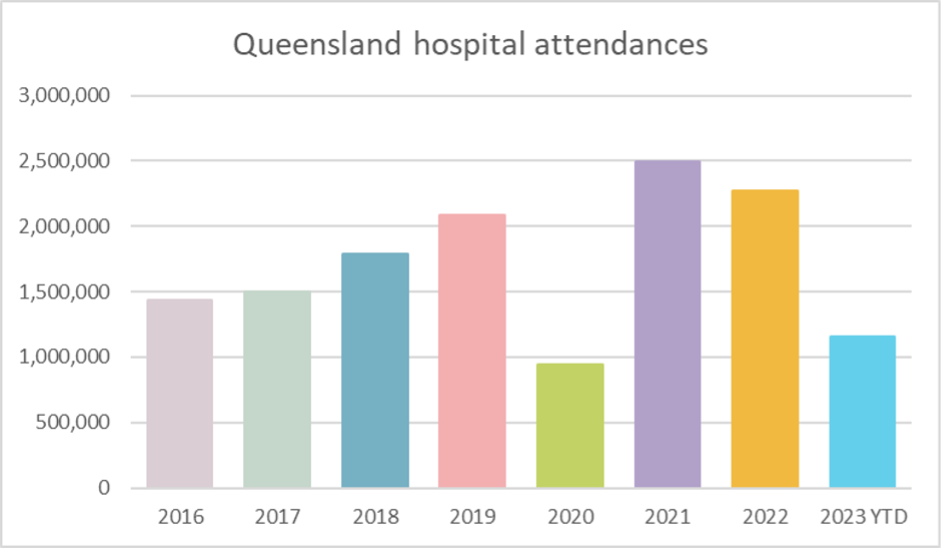
Queensland hospital attendances
Queensland sees a steady increase in hospital attendances since 2016, with the exception of the 2020 downward spike. The spike in 2020 is because during the COVID-19 pandemic, Queensland hospitals stopped recording emergency department data from March to September inclusive.
Overall performance of hospitals
Emergency department clinically recommended wait times are:
- Category 1 — Immediate treatment
- Category 2 — 10 minutes
- Category 3 — 30 minutes
- Category 4 — 60 minutes
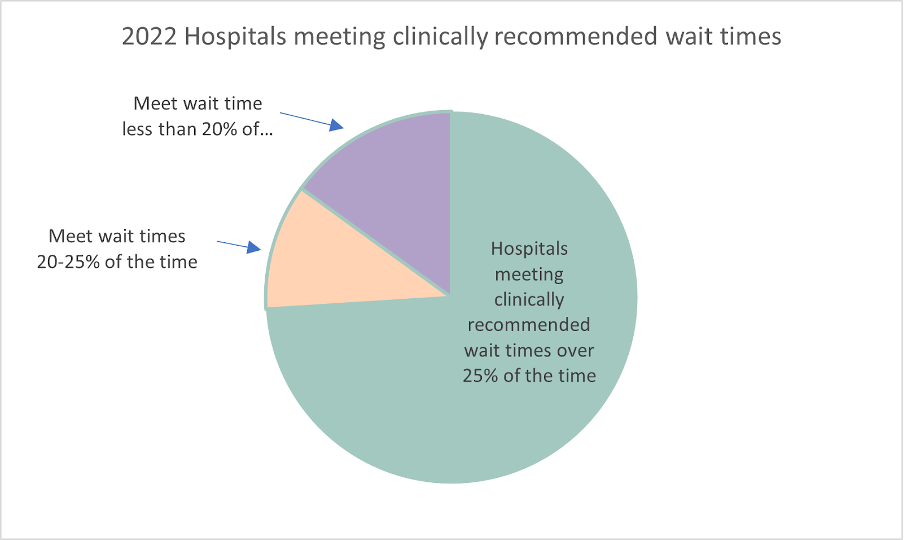
In 2022, 74% of Queensland emergency departments met the clinically recommended wait times more than 25% of the time.
Hospitals meeting clinically recommended wait times
The three best performing hospitals were Wandoan Hospital, Mitchell Hospital and Taroom Hospital. All three hospitals saw patients within the clinically recommended wait times 33% of the time. Interestingly all three hospitals are located around the Roma region, approximately 500km west of Brisbane. This region of Queensland is cattle country and home to the southern hemisphere’s largest cattle sale yards.

Ten Queensland hospitals saw a jump in attendances higher than 10% year-on-year, from 2021 to 2022.
| Hospital | Hospital attendances YoY % increase from 2021 - 2022 |
|---|---|
| Kilcoy Hospital | 41.33% |
| Clermont Hospital | 26.70% |
| Tara Hospital | 24.93% |
| Taroom Hospital | 22.99% |
| Jandowae Hospital | 18.78% |
| Woorabinda Hospital | 17.06% |
| Julia Creek Hospital | 14.53% |
| Normanton Hospital | 14.36% |
| Gatton Hospital | 13.11% |
| Caloundra Hospital | 12.84% |
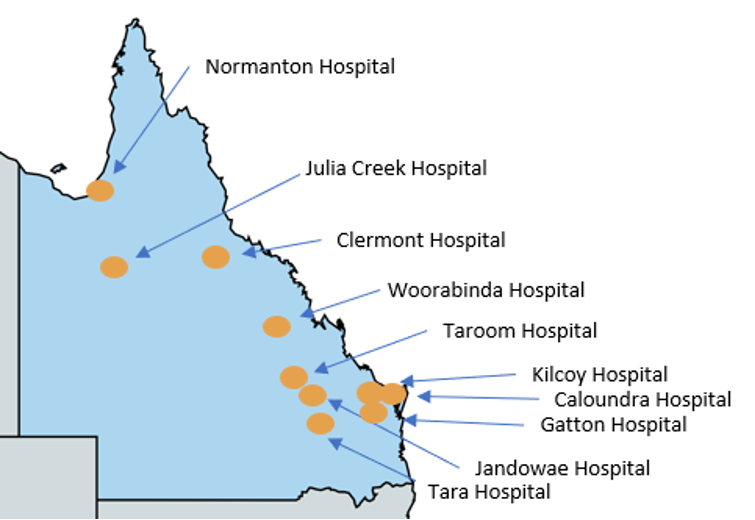
Eight of these hospitals are inland and only two on the coast (Normanton and Caloundra).
Map of Queensland with locations of the top 10 hospitals with the highest year on year increase in attendances
Hospital in focus — Bamaga
Bamaga Hospital is the northernmost hospital in Australia, situated at the very tip of Cape York. The population of Bamaga is 1,164 of which Aboriginal and/or Torres Strait Islander people make up 82% of the population. Bamaga emergency department sees an average of 4,288 patients a year. The hospital has seen significant improvement in the time it takes to treat patients from 87 minutes in 2018 to only four minutes in 2022. Interestingly however, 32% of patients in 2022 did not wait for treatment, whereas in 2018 only 9% did not wait. Good news for Bamaga is that since the start of 2023, the average of patients not waiting for treatment is only 3%.
Topographic map of Bamaga in Cape York, Queensland

Other Australian state data
Each Australian state publishes emergency department and health statistics in a different format. To find data on your state, please see the information below:
New South Wales provides an excellent health data with reports based on selected criteria in their Bureau of Health . Select a topic or an area of interest along with specific hospitals and time frames to be presented with survey results.
The WA Department of provides WA health performance on emergency departments, by hospital as well as admission data summaries.
The Victorian Agency for Health provides a range of Victorian service performance ranging from emergency care to hospital admissions and waiting times. The data is presented in graph or tabular format depending on the filters selected.
The Northern Territory Open Data provides datasets on emergency department care dating back to 2016.
Tasmania has the Tasmanian Health System with an overview of important aspects of the public health system.
SA Health provides an SA emergency department with current data and current wait times for all hospitals as well as some SA historial health .
ACT provides an ACT HealthStats with access to data collections for a range of topics.