
Starting our journey toward a public shared cluster
In 2021 Salsa Digital decided to stand up its own public multi-tenant cluster to run , an open source web application delivery platform. On the face of it this doesn't sound like a huge endeavour. After all, the cloud makes it quick and easy to create new resources. But a cluster really is just one small part of an overall solution. There are numerous other aspects, such as forming a team, building the infrastructure using code, deploying and configuring the numerous supporting services, ensuring everything is secure and runs smoothly, etc. This paper describes at a high level some aspects of this ongoing journey.
Lagoon is a platform that manages the delivery of an application from source to multiple destination environments. This allows a developer to stand up a local development environment that is representative of production. The application can then be deployed into multiple shared development environments before finally making its way into production. Lagoon specialises in Drupal and Wordpress CMSs, but it's not limited to delivering just those types of application. Over many years and in partnership with (the Lagoon developers), Salsa Digital has helped government, academic and enterprise customers serve their websites using Lagoon.
The Lagoon platform is composed of numerous microservices and is designed to be deployed into a Kubenetes cluster. Lagoon is a complex application. However, Lagoon also needs numerous supporting services. Things like shared databases and filesystems, an Ingress Controller, a Docker registry, logs aggregation, backup controller, email, virus scanning, etc. There are also numerous other tools that need to be deployed into a cluster to support key requirements such as monitoring, alerting, dashboarding, firewalling, TLS certificate generation, identity management, intrusion detection and remediation, auditing, vulnerability scanning, job automation, automated DNS configuration, etc. AWS and Kubernetes (EKS) are really just the starting point.
Building the team

The first thing that needed to be done was to form a team — initially to build the platform but then to support it once the first customers came on-board. This team had to be highly skilled and experienced to hit the ground running. Although the initial layers of the platform needed to be built quickly it was vital that the foundations were solid and therefore would allow future growth without reworking the fundamentals. Everything needed to be code (Infrastructure as Code). Everything needed to be documented, practised and timed. And, a cookie cutter approach was needed so that additional clusters, both for Salsa and Salsa’s customers, could be stood up quickly and consistently.
To help the team understand, build and support the platform a handbook was needed. The handbook documents areas such as the platform architecture, the deployment and configuration of all platform components, backups, disaster recovery procedures, alert definitions, runbooks for what to do in the event of an alert or some other failure, day-to-day processes, audit information and reports, team structures and administration, reference information such as repos, developer tools, terms, etc. Basically everything and anything to do with the platform, support of the platform, extension of the platform and team organisation.
The underlying tools

For Infrastructure as Code (IaC) the two major tools used are and . Terraform creates the AWS cloud resources and Helm deploys and configures the majority of workloads that are orchestrated by Kubernetes.
Terraform creates AWS resources such as EKS (the Kubernetes cluster), Aurora (RDS), EFS, S3, SES, IAM Roles / Policies / Users, VPN, Elasticache, Route53 zones and records, VPCs, subnets, Security Groups, NAT Gateways, Load Balancers, Cloudwatch configuration, etc. Sets of AWS resources are created as a group. These logical groups mean that there isn't a single Terraform script to do it all. This has benefits around reducing the blast radius and making it easier to understand exactly what will change. And this in turn greatly reduces the risk. Each Terraform script uses custom Terraform modules, with the Terraform modules containing the core logic of what needs to be done. Using this approach it's possible to version control the modules and have different clusters reference different versions, allowing for incremental development and roll-out.
Helm is used to deploy Lagoon and numerous other supporting tools into Kubernetes. There are nearly 40 Helm releases and this figure will continue to grow as the platform evolves. Apart from Lagoon, which has 5 Helm releases, there are Helm releases for many supporting tools. This includes workloads such as the Nginx Ingress Controller, Opensearch, Prometheus, Grafana, Sloth, Kubecost, Cert Manager, External DNS, Falco, Calico, Keycloak, Velero, k8up, Starboard, Kube-bench, Kube-hunter, ClamAV, Postgresql, etc. Some of these Helm releases are for , with these Operators then taking care of managing various platform components. As a general rule, if a workload supports running in HA then it's configured that way. And this allows the platform to have high resiliency.
Monitoring the platform
In any modern platform it's vital to have a robust observability solution in place. This includes capturing logs and metrics, visualising them using dashboards and alerting when a warning or critical condition occurs. Having predictive alerts, such as when a filesystem is expected to fill up based on previous growth history, also allows for proactive maintenance. Dashboards work best when they have context-based drill-down links to related dashboards. This makes it easier to reason about overall system behaviour and also helps to guide the operator. With alerts, it is important to have clear/simple messages and documentation that describes the reason for the alert and any steps that can be taken to remediate it.
is the primary tool used to collect metrics and raise alerts. It has a large eco-system of exporters and is the de facto standard in cloud native computing. Exporters facilitate the integration of a wide range of metric sources, such as from AWS Cloudwatch and Kubernetes. Also, it's now quite common for a workload to provide a Prometheus endpoint to surface internal metrics. Additionally, there are utility tools that make it easier to work with Prometheus. One such tool we use is called . Sloth automates the creation of recording/alerting rules to ease the production of . is another tool used with Prometheus. Kubecost allows gathering AWS cost metrics to intelligently charge customers for resources used by their Lagoon projects.
Of course, dashboards are not only useful for the operators of a platform. They're also essential for end users so that they can understand their own workloads — both from a logging and metrics viewpoint. This requires a multi-tenant solution so that each customer can view only the logs and metrics that are relevant for their projects. And a special innovation that is currently being worked on is for a customer to be able to see how much carbon their workloads are producing. This makes it easy to see how much carbon can be saved by using some of the innovative capabilities of the platform, such as serving static representations and/or running in eco-mode for content editors.
Platform security

Fundamental to the platform is that everything is highly secure and able to be protected from the numerous attack vectors in today's threat landscape. This starts at the edge with the Quant CDN/WAF and extends through into the origin Kubernetes cluster/cloud environment. All data needs to be encrypted in transit and at rest. Networks need to have tightly scoped firewall rules to allow them to be segmented, including at the Kubernetes Pod level. RBAC is used in numerous areas of the platform and a VPN protects administrative interfaces. Scheduled reports for compliance and vulnerability assessment are run with their outputs automatically uploaded to an audit section of the handbook.
Security is a crucial and complex necessity when it comes to running a cluster. It's vital to adopt a security-conscious mindset and approach when developing any platform components or integrations. This means taking into account various aspects of security, including data protection, access control, network security, compliance, and monitoring, to ensure a secure and reliable environment for your workloads.
Platform performance

Another fundamental aspect of the platform is that it performs well. In part this requirement is realised by running multiple replicas of many platform components, such as the Ingress Controller or log aggregators. From a Lagoon project perspective it's vital that the production environment can auto-scale as demand increases. This is enabled by the use of a Horizontal Pod (HPA). Also, the size of the cluster needs to be elastic to accommodate fluctuations in the number of workloads that must be run. Using the K6 it's possible to execute large, distributed load tests to check platform performance for both the control plane and Lagoon projects.
Disaster recovery
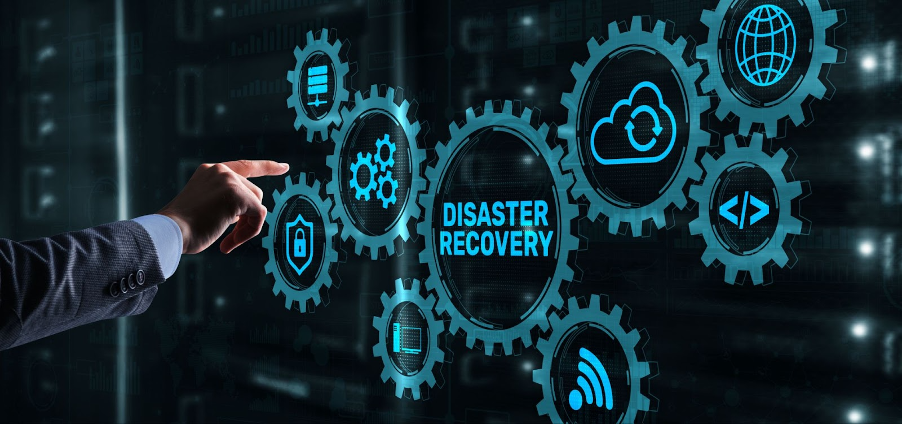
With all this complexity there are many opportunities for component failure, both in the Kubernetes layer and also in the cloud layer. This means that it's vital there's extensive disaster recovery (DR) documentation that covers all major failure scenarios. And this DR documentation needs to be practised on a regular basis to ensure it's still relevant and comprehensive in nature, refining it over time to progressively become more encompassing. A test cluster is especially important for practising the DR plans, and the test cluster also allows for changes to be validated first before applying to the production cluster.
The platform’s evolution
Something that has been incredibly useful in shaping the platform has been the number of government and enterprise tenders submitted. Each tender has allowed for additional items to be added to the backlog, which has progressively filled any gaps and helped to ensure that the platform is both cyber secure and government grade — all the while being a sovereign Australian solution.
Without a professional, dedicated and highly skilled team none of this would have been possible. It is, in fact, the biggest ingredient in the success of the Salsa Hosting platform. It's vital to have people who are fast learners, able to work independently and who are totally trustworthy. Ensuring a shared vision when building a platform requires regular catch ups and show and tells. Knowledge sharing and helping each other is fundamental to team cohesion.